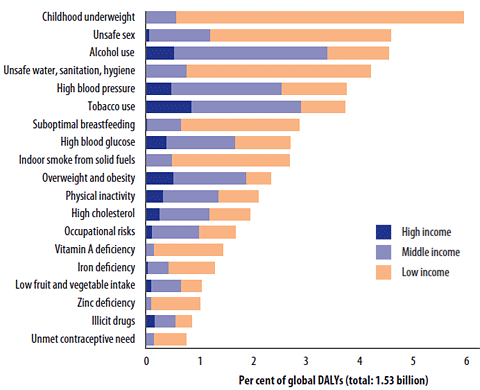
Along with salt, sugar and tobacco, alcohol stands out as a key “risky commodity” affecting global rates of noncommunicable disease. In this post, we look at new epidemiological surveillance and industry data on alcohol sales and consumption from around the world. We look into what populations are most affected by alcohol abuse, and what policy responses seem to have been successful in reducing morbidity and mortality from risky drinking.
Current epidemiology
There is some consensus among the public health community that while alcohol use in general is common and not necessarily harmful, sub-populations of heavy users seem to be consistently affected by preventable morbidity and mortality events attributable to alcohol. The most recent estimates of alcohol-related deaths suggest that about 2.5 million deaths each year are directly attributable to alcohol, with the highest percentage of alcohol-related deaths among people between 15 and 29 years old (alcohol is responsible for nearly 1 out of 10 deaths in this age group worldwide). This makes alcohol the world’s third largest risk factor for disease; it is the leading risk factor in the Western Pacific and the Americas and the second largest in Europe. In looking at disaggregated alcohol-related death data, it appears that harmful drinking mostly leads to unintentional injuries and cardiovascular diseases, followed by cirrhosis of the liver and various cancers; an increasing number of analyses also find a significant burden of sexually-transmitted diseases attributable to alcohol intoxication, including HIV/AIDS infections, and a number of infections attributable to alcohol’s immuno-modulating properties, which predispose alcoholics to diseases like tuberculosis (however, this may be confounded by housing insecurity among chronic alcoholics, as living in cramped quarters is an independent risk factor for TB infection).
Worldwide alcohol consumption in 2005 was equal to 6.13 litres of pure alcohol consumed per person aged 15 years or older, on average. Analysis from 2001-2005 showed that countries in the Americas, Europe and Western Pacific regions had relatively stable consumption levels during that time; but marked increases were seen in Africa and South-East Asia during the five-year period. Despite widespread consumption, most people in the world actually do not drink. Almost half of all men and two-thirds of women did not consume alcohol, according to the latest information made available in the 2011 WHO report on alcohol use. Abstention rates are low in high-income countries and highest in North Africa and South Asia. But in countries with high abstinence rates, the few people who do drink seem to consume alcohol at very high levels.
Consumer trends
Most of the epidemiological research on alcohol focuses on two variables: the total volume of alcohol consumed per person, and the pattern of drinking (e.g., daily drinking versus binge drinking). The total volume of alcohol consumed per capita is easier to track; by comparison, it’s difficult to fully tease apart changing patterns in drinking without careful survey-based or ethnographic studies. The data on longitudinal drinking trends is mostly in terms of per capita consumer purchasing of different types of alcohol products (hence, it may be higher than actual consumption if significant amounts of alcohol are wasted, or it may be lower than consumption in regions where a lot of alcohol is home-made, i.e., moonshine, or smuggled rather than bought in stores).
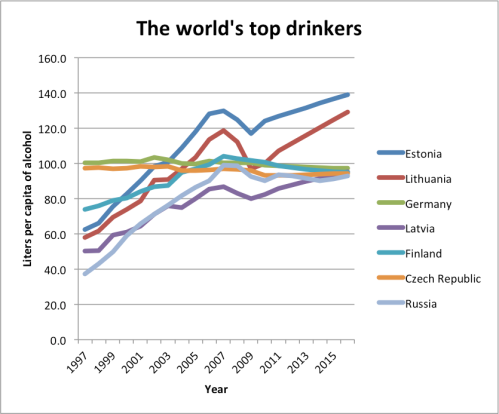
In terms of overall consumer trends, Estonians and Lithuanians have rapidly become the world’s dominant drinking populations over the last few years. When measured by overall liters of alcohol consumed per person, the two countries have rapidly increased their per capita drinking from around 60 liters per person per year in 1997 to over 100 liters per person per year in 2011; industry projections suggest they will near 140 liters per person per year in the near future (see the graph below, where 2012-2016 estimates are industry projections). Latvia, Finland and Russia are close behind, but have plateaued their consumption rates at a relative steady-state near 90 liters per person over the last few years, having experienced a rapid increase during their periods of post-Soviet stress. Other heavily-drinking countries like Germany and the Czech Republic have stayed steady during the last decade.
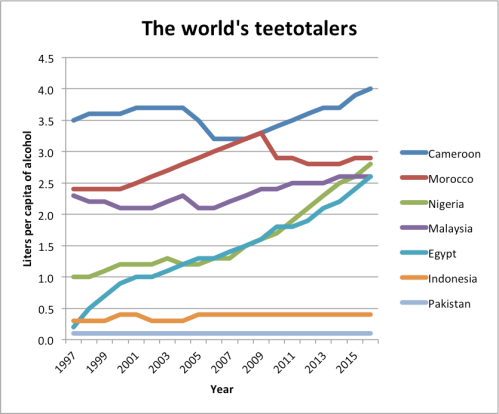
The least drinking seems to take place in Muslim countries of North Africa and South Asia (graph below), though drinking is becoming increasingly popular in Egypt and Nigeria. To provide a sense of scale, the worldwide average consumption rate was 19 liters per person per year in the year 1997, 23 in the year 2011, and is projected to rise to 25 in 2016. In the US, the average consumption rate was 73 liters per person per year (about 19 gallons) in 1997, 70 liters in 2011, and is projected to decline to 67 liters by 2016.
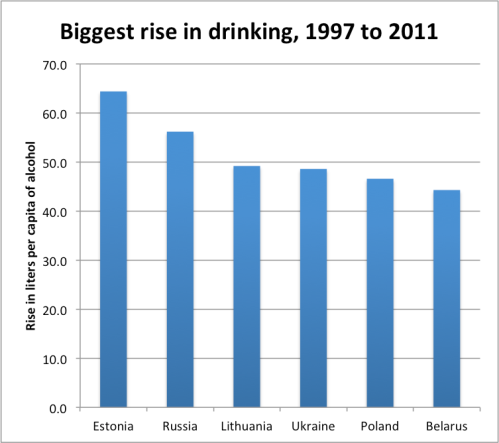
In contrast to the absolute volume of consumption, if we look at the changes in consumption over the last few years, Estonians and Russians top the list as having increased their per capita liters of consumption of alcohol by more than 50 liters per person between 1997 and 2011. Other Eastern European states were close behind, averaging a 41 liter per person increase between 1997 and 2011. There is increasing evidence to suggest this may have been related to the mass privatization of former USSR territories and associated declines in social welfare supports and employment opportunities among working-aged men (reminiscent of the current austerity measures ongoing in European nations like Greece, Poland and Italy, a potential warning for policymakers during the ongoing recession).
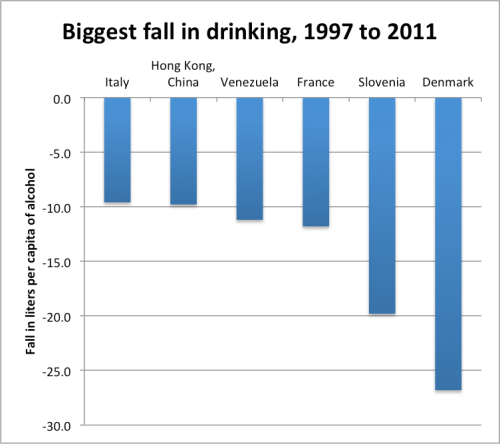
A few nations did appear to reduce their per capita drinking rate substantially, most commonly in countries where alcohol use policies were in effect (the price control policies described further below). The biggest fall was in Denmark, but interestingly this was followed by Slovenia–which despite its proximity to other Eastern European nations with large increases in drinking, actually managed to have social support and alcohol policies in place that buffered its population and reduced net consumption by almost 20 liters per person between 1997 and 2011.
What have all these people been drinking? Four Loko? Martinis? Beer actually remains the world’s most popular drink, averaging 17.5 liters of consumption per person per year currently. Beer is followed by wine (about 3 liters per person per year) then spirits (2.2 liters per person per year). Most of Eastern Europe’s increase in consumption actually appears to be in the form of beer consumption (a rise of 39 liters per person per year from 1997 to 2011), in spite of stereotypes about Russian vodka (hard liquor and spirits actually remained fairly constant in consumption in Eastern Europe during this period). Most of the decline in consumption in the US and North American generally is also from reduced consumption of beer (a drop of about 4.4 liters per person per year from 1997 to 2010).
Drinking behaviors
Some limited data seem to suggest that the greatest risk from alcohol use is among people who engage in “binging”, or consuming 60 or more grams of alcohol content in a single sitting. Data on average per capita alcohol consumption really fails to capture drinking behaviors such as whether people are binging or using alcohol on a daily basis. In an attempt to characterize these more dangerous patterns of drinking behaviors, a group of researchers created a “patterns of drinking score“. The score tries to describe the relative burden of alcohol-attributable disease in a country on a scale of 1 (least risky drinking pattern) to 5 (most risky drinking pattern). The score is based on three different dimensions: four different aspects of heavy drinking occasions (i.e. high usual quantity of alcohol per occasion, festive drinking common at fiestas or community celebrations, proportion of drinking when drinkers get drunk, and proportions of drinkers who drink daily or nearly daily), drinking with meals, and drinking in public places.
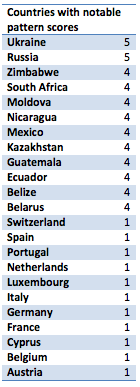 A score of 5 really isolates countries where more than 2/3 of the alcohol is consumed during heavy drinking occasions (binging). In addition to Russia, the highest pattern of drinking score was in Ukraine; interestingly, this should not indicate that something intrinsic to economic distress or European culture must be causing binging behaviors, as some of the countries with a score of 1–such as Cyprus, Italy, Portugal and Spain–are traditionally liberal with social alcohol use, and have been heavily hit by economic recessions, but manage to avoid risky drinking trends. A full table of the drinking scores is available here, and the highest and lowest scoring countries are itemized in the table below. Of note, the little data available from sub-Saharan Africa suggest potentially high levels of problem drinking there as well (though the two countries from which reliable data are available have been known to have a high rate of problem drinking among male migrant laborers, such as gold miners). Many Latin American countries also top the list.
Morbidity and cost
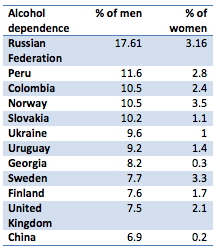
In terms of absolute mortality attributable to alcohol, Russia stands out as having recorded over 800 deaths per 100,000 men in 1994 (decreasing only to 290 per 100,000 by 2002, still higher than nearly any other nation). Russia also has the highest prevalence rate of alcohol dependence among adults, with almost 20% of men currently thought to meet criteria for alcohol dependence (chronic alcoholism). The table below lists the countries facing the highest burden of dependence, revealing that the problem appears particularly troubling in Europe and Latin America, though data from countries in Sub-Saharan Africa is lacking for comparison.
Despite having the highest rates of dependence and death from alcohol, Russians don’t seem to make it to the hospital in time for treatment. The highest rates of hospitalizations for alcohol-related injuries and poisoning are actually in Latvia and Lithuania, where rates of hospitalization exceed 2,000 per 100,000 people per year. Road traffic accidents attributable to alcohol are thought to be highest in Slovenia, which records 77 alcohol-related accidents per 100,000 people.
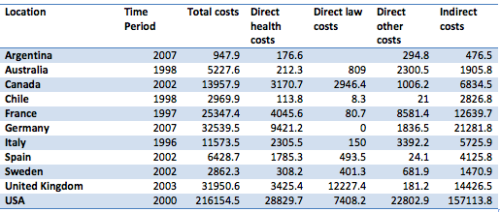
The World Health Organization (WHO) recently attempted to quantify the social and economic costs of risky alcohol use using techniques we described earlier; the next table (in millions of $US) shows their estimates from countries where the best data are available.
Policy responses
The newly published Global Status Report on Alcohol and Health summarizes available evidence on alcohol consumption and provides data from over 100 countries. It reveals that few places use effective policy measures to prevent death, disease and injury from alcohol use. Since 1999, when the WHO first began to report on alcohol policies, at least 34 countries have adopted some type of formal policies to reduce harmful use of alcohol. Restrictions on alcohol marketing and on drink–driving have increased, but there are no clear trends on most preventive measures. Many countries have weak alcohol policies and prevention programs. A few key strategies have been found to be most useful and cost-effective: (1) regulating the marketing and availability of alcoholic beverages (in particular to younger people); (2) enacting drunk-driving laws; (3) reducing demand for alcohol through taxation; and (4) providing accessible and affordable treatment for alcohol dependence. To keep track of progress in implementing these measures, the WHO has created a Global Information System on Alcohol and Health (GISAH) to present data on levels and patterns of alcohol consumption, alcohol-attributable health and social consequences and policy responses.
A recent systematic review of alcohol control policies has tried to shed light on which policy options may be best for the coming years, incorporating not only the public health implications of reducing risky alcohol use but also the social and economic effects of alternative policies (including potential negative impacts on alcohol-related industries such as restaurants). The reviewers found that unlike taxation of alcoholic products, requiring minimum prices on alcoholic products circumvents retailers’ ability to absorb price increases, so all alcohol currently sold below the minimum price per unit would become more expensive with the introduction of this policy. Since the price effect of this policy is especially strong for low-cost alcohol, minimum pricing has important implications for young and hazardous/harmful drinkers and low- income groups, who are more likely to purchase cheaper drinks. The direct costs to producers and retailers of implementing this regulation are likely to be relatively small, but the government generates no revenue from a minimum price policy. By contrast, the impact of a ban on sales below cost depends on the extent to which retailers engage in this pricing strategy. There is evidence that sales below cost are particularly common in some countries like the UK in the supermarket sector, and specifically during times of high demand (such as Christmas). It is also possible that retailers (especially large supermarket chains) would lower alcohol prices further in order to circumvent a ban on below cost sales. The effect on consumption of a ban on sales below cost, therefore, may be relatively small compared with broader restrictions on discounts and promotions, and also with the introduction of certain minimum prices or tax hikes. Finally, when they are passed on to consumers, taxes affect all drinkers, who either pay more to consume the same amount, reduce the amount they drink, or substitute for cheaper beverages or other products. This is why taxation has been considered a “blunt instrument” that does not target those drinkers who cause harms, instead affecting all consumers to some extent. An important aspect of taxation is that, unlike with the two other pricing policies examined, the government obtains additional revenues from tax increases.
Further analyses like this one will surely emerge as increasing attention is focused on how fiscal and regulatory policies might impact on salt, sugar and other “risky commodities” beyond alcohol. But alcohol use patterns do provide some preliminary lessons about the epidemiological environment of risk: that demographic trends in consumer purchasing can rapidly shift among populations, that the pattern of consumption may be just as important–or more important–than the actual amount of consumption, and that there remains a very large gap between the knowledge that cost-effectiveness interventions exist and the actual implications of such interventions.


Pingback: Alcohol Problems That We Face Today
Pingback: Spring break readings | The Pulse
This is a really good analysis and breakdown of the effects of alcohol and showing countries at most risk. Often its hard to know what is fact and fiction when new research is released, but I suppose some of the hard facts of deaths attributable to alcohol are some of the biggest and hardest evidence we can use. I had no idea Beer was so high on the radar. Good post.
“Alcohol use around the globe: new data trends | [ EpiAnalysis ]”
was in fact a fantastic blog, cannot wait to go through more of your articles.
Time to squander a lot of time on the net hehe.
Thanks for your time ,Harley